
Tracking Flare-Ups in Chronic Illness: Patterns, Triggers, and Management
Understanding flare-ups through data
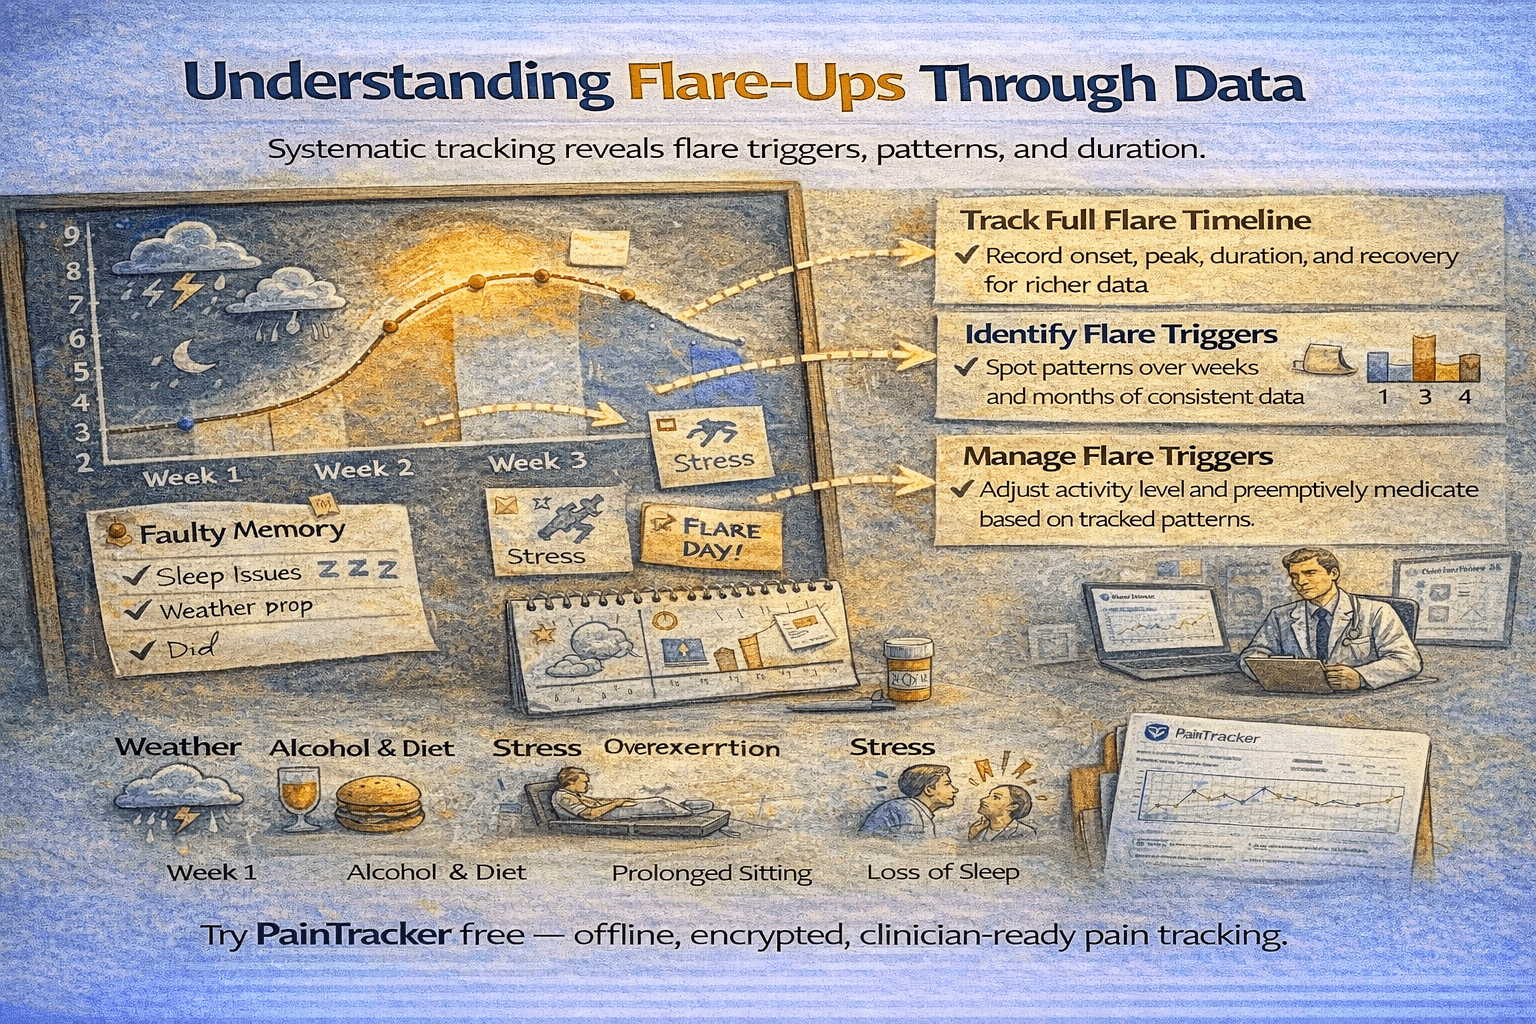
Chronic illness flare-ups often feel unpredictable—sudden escalations of symptoms that disrupt daily life without obvious cause. But research and clinical experience show that most flares have identifiable triggers or precursors, and consistent symptom tracking is the most reliable way to find them. What feels random in the moment often reveals patterns when viewed across weeks or months of data.
A flare is not a single data point—it is a pattern of elevated symptoms over hours or days, often preceded by warning signs and followed by a recovery period. Tracking the full arc of a flare—onset, peak, duration, recovery—provides richer clinical information than recording only the worst moment.
Documenting flare severity and duration
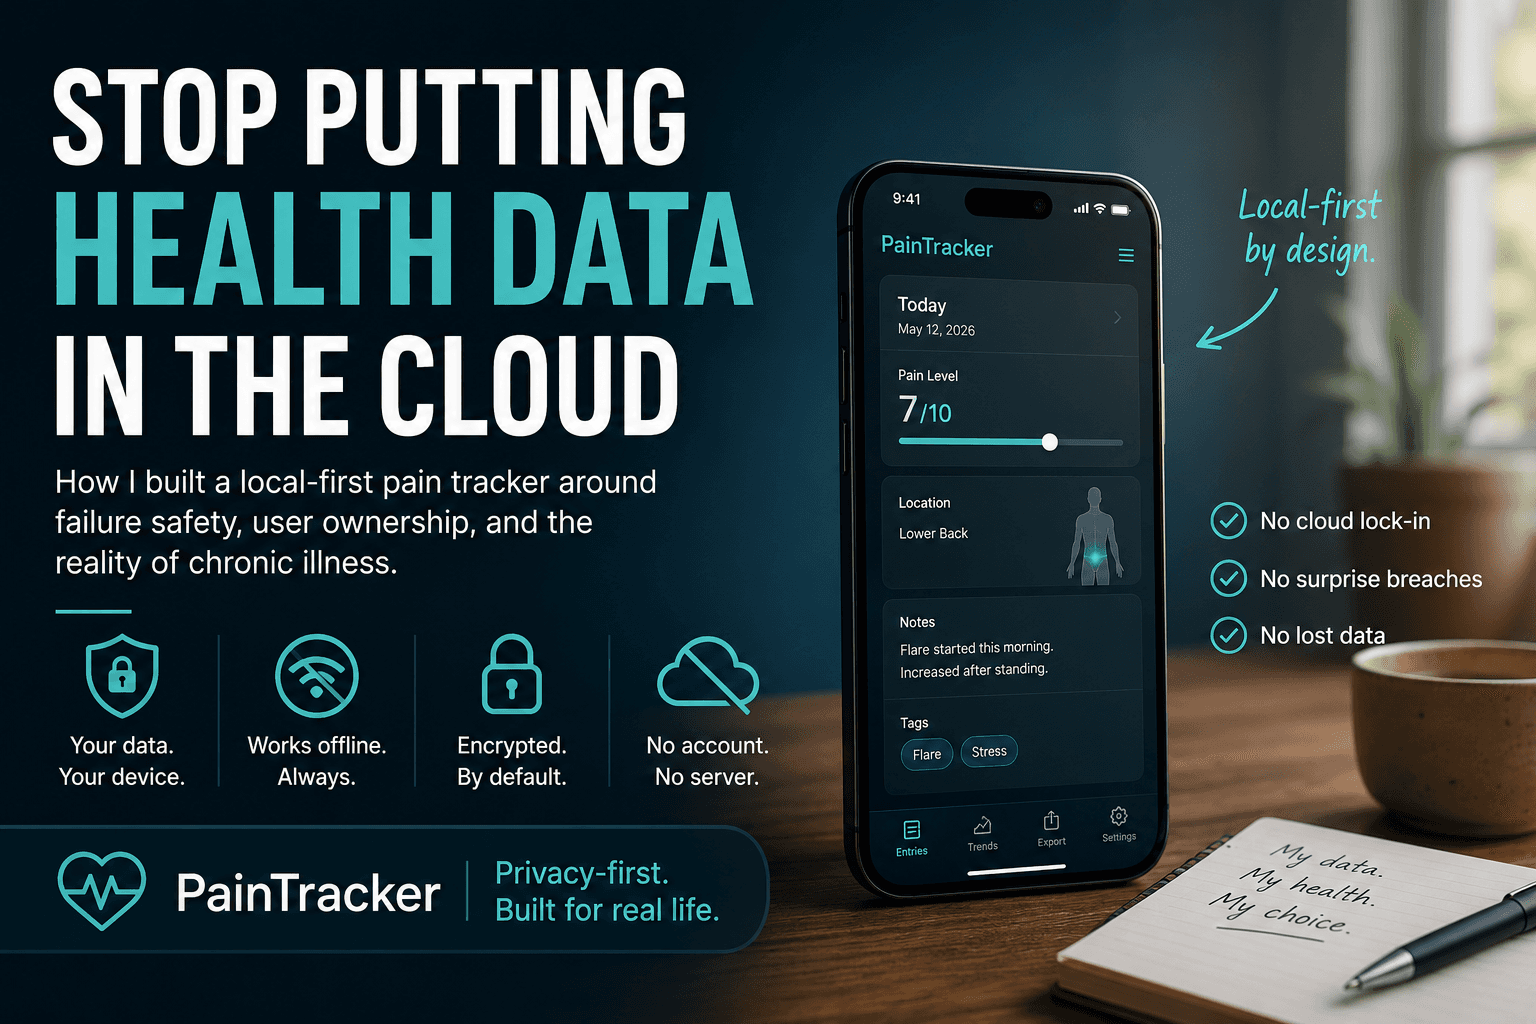
Consistent severity measurement during flares is critical for comparing one flare to another. Was this flare worse than last month's? Longer? More disabling? Without structured tracking, these comparisons rely on memory, which is unreliable during periods of high pain and distress. PainTracker's daily intensity recording creates a continuous timeline that makes flare comparison objective.
Duration matters as much as peak severity for clinical assessment and self-management. A flare that peaks at intensity 8 but resolves in two days may be less functionally disabling than one that peaks at 6 but persists for two weeks. Recording daily data through flares captures both dimensions.
Identifying flare triggers
Common flare triggers include physical overexertion, sleep disruption, emotional stress, weather changes, dietary factors, hormonal fluctuations, and illness. The challenge is that triggers often precede flares by one or two days, making the connection invisible without tracked data that you can review retrospectively.
PainTracker's tagging and notes system lets you record potential triggers alongside your daily entries. After several flares, review the days preceding each one: what activities did you do, what was the weather, how did you sleep, what was your stress level? Patterns typically emerge within two to three months of consistent tracking.
Flare management and pacing
Once you identify your triggers, tracking supports proactive flare management. If you know that exceeding a certain activity level reliably triggers a flare two days later, you can pace your activities accordingly. If weather changes are a consistent trigger, you can pre-medicate or adjust your schedule. Data transforms reactive suffering into proactive management.
Tracking also supports pacing—the practice of balancing activity and rest to avoid the boom-bust cycle common in chronic illness. By recording activity levels alongside symptoms, you can identify your sustainable activity threshold and learn to stay within it most of the time.
Communicating flare patterns to your care team
When you can show your doctor a three-month timeline with flare events marked—including triggers, severity, duration, and treatment response—the clinical conversation becomes much more productive. Instead of describing flares verbally, you are presenting objective data that supports treatment decisions.
PainTracker's export tools let you create reports that highlight flare periods within the broader context of your daily tracking. This contextualised view shows your care team not just what happens during flares, but what your baseline looks like, how quickly you recover, and whether flare frequency is changing over time.
Try PainTracker free — offline, encrypted, clinician-ready pain tracking.